Sierra snowpack surging

Did you know? The Department of Water Resources recently conducted their April snow survey using data from 130 stations placed throughout the state. The survey found statewide snowpack has a snow water equivalent of 28.6 inches, or 110% of average for this time of year — up from just 28% of average on January 1st. Get more numbers from DWR.

Algorithm Appreciation

Rather than median sales price, the S&P CoreLogic Case-Shiller Index uses a special mathematical formula based on the past few months of sales data to plot the course of home appreciation over time. As you can see from this graph, prices in the Bay Area have outpaced national trends since we emerged from the Great Recession.

Accelerating into Spring

After a cool and frosty winter, the market is experiencing a boom in early 2024. As of February, approximately 56% of home sales were made in less than a month, with a median of 38 days on market. Additionally, 20% sold over list price, 21% were purchased as investments or second homes, 26% were bought by first-time homebuyers, and 33% were all-cash purchases — the highest monthly share of sales in almost 10 years.

Anyone can appreciate this.

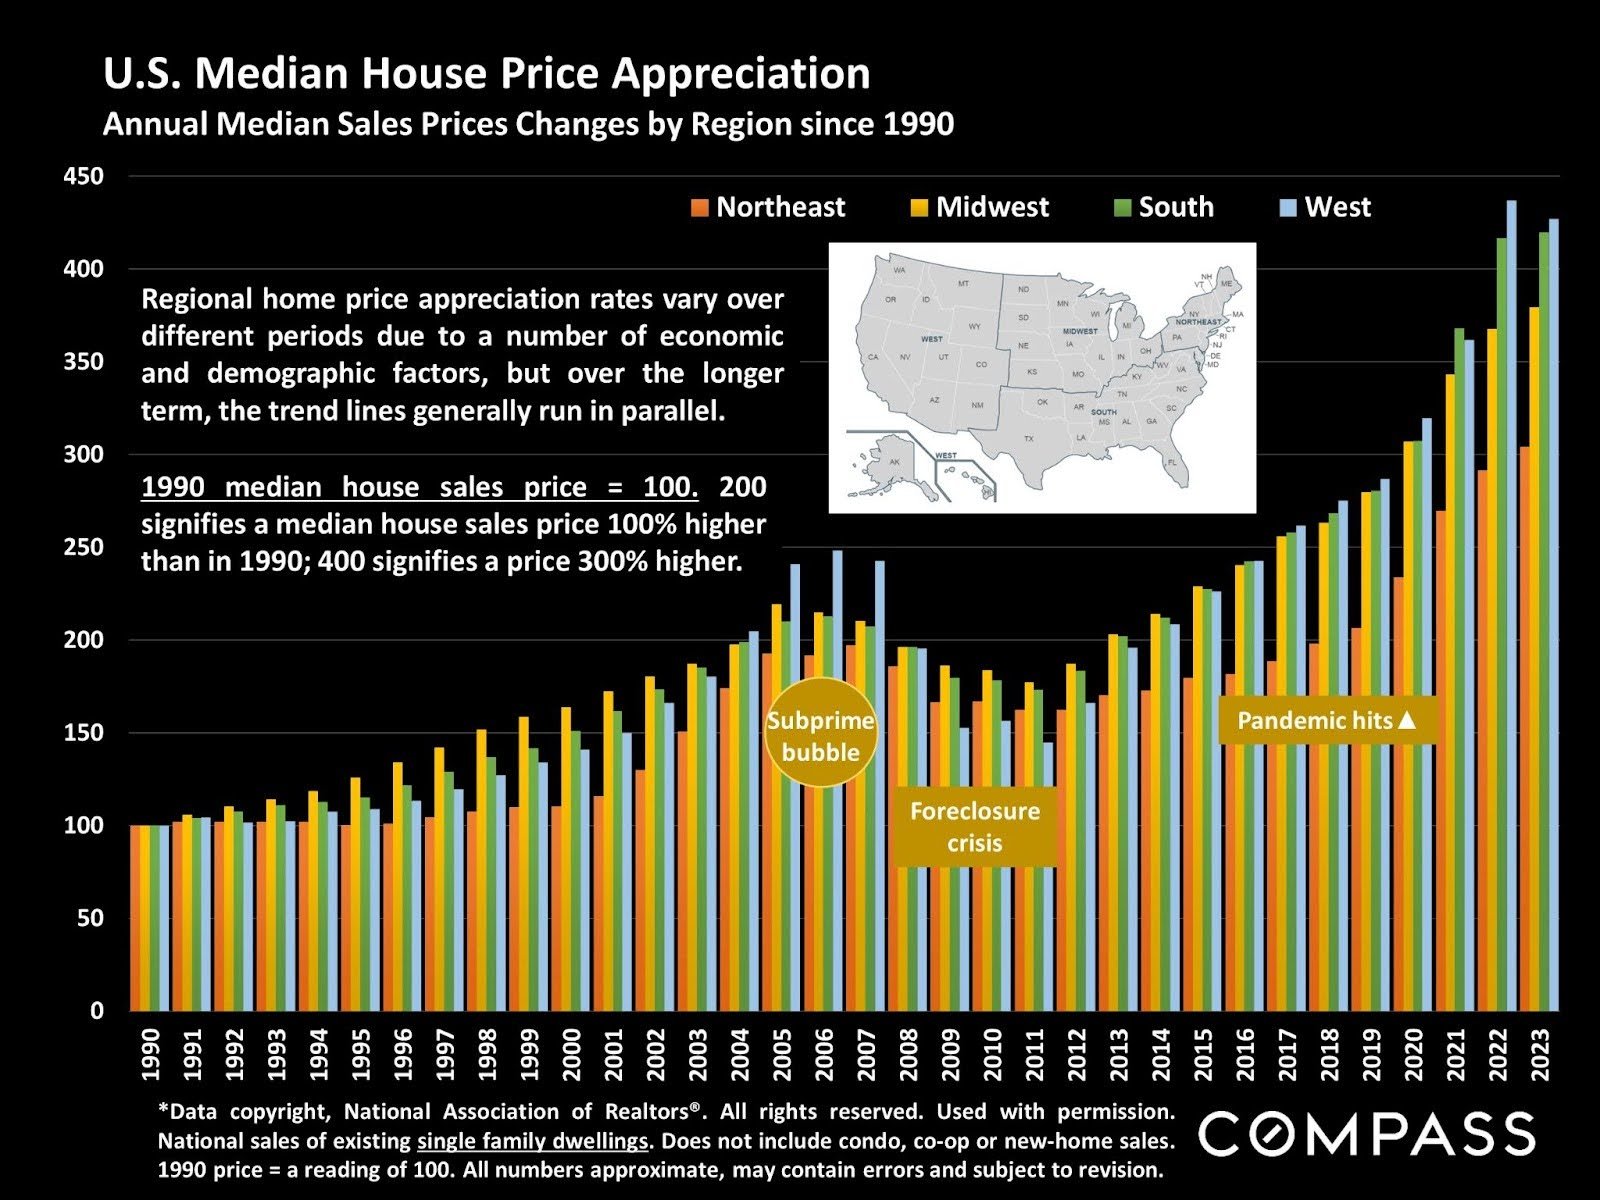
If you ever needed a visualization of the rising cost of homeownership, this chart should do the trick. Tracking median house sales price fluctuations by region since 1990, you can see a significant shift to the West and South and away from the Northeast, even as prices have appreciated across the country. Of course, the last spikes we saw in western sales led to the subprime bubble, so it’s good for investors to be cautious.