Geek's Number Talk: Strong Finish/Hot Start
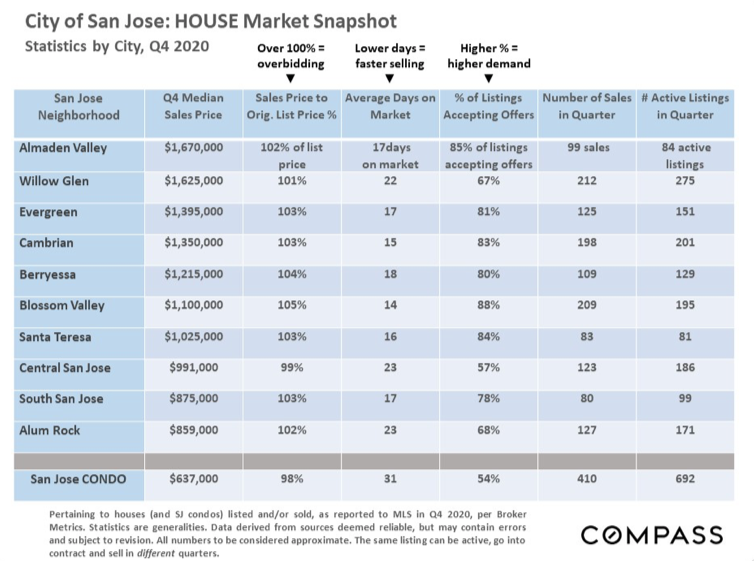
/The tables below reflect market statistics and values for Q4 2020. It’s no surprise that we saw a hot finish to 2020 as final quarter numbers are often starkly different from stats for the full year. It’s also not unusual for more expensive markets to have softer supply and demand statistics — such as higher average days on the market and lower percentages of listings accepting offers within the period — though this is certainly not always the case.